The Effects of Resource Availability on Organisms and Populations of Organisms in an Ecosystem
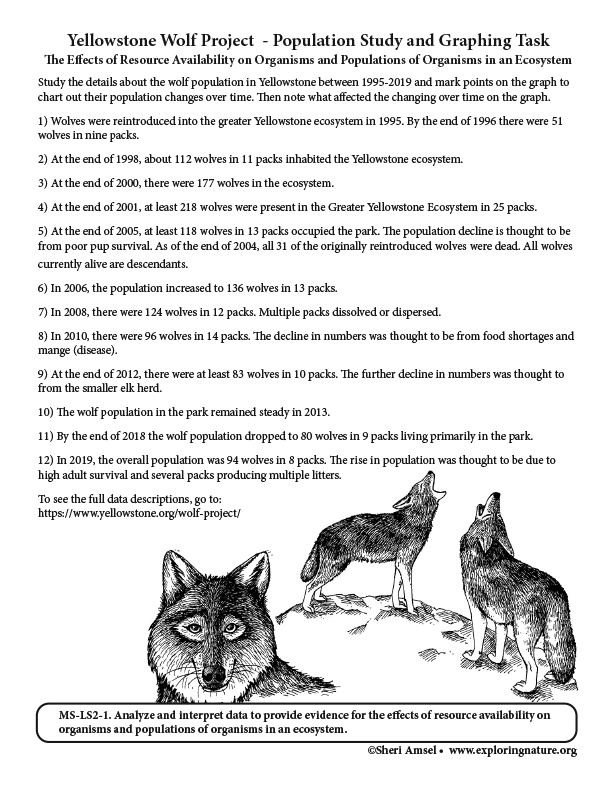
Study the details about the wolf population in Yellowstone between 1995-2019 and mark points on the graph to chart out their population changes over time. Then note what affected the changing over time on the graph.
1) Wolves were reintroduced into the greater Yellowstone ecosystem in 1995. By the end of 1996 there were 51 wolves in nine packs.
2) At the end of 1998, about 112 wolves in 11 packs inhabited the Yellowstone ecosystem.
3) At the end of 2000, there were 177 wolves in the ecosystem.
4) At the end of 2001, at least 218 wolves were present in the Greater Yellowstone Ecosystem in 25 packs.
5) At the end of 2005, at least 118 wolves in 13 packs occupied the park. The population decline is thought to be from poor pup survival. As of the end of 2004, all 31 of the originally reintroduced wolves were dead. All wolves currently alive are descendants.
6) In 2006, the population increased to 136 wolves in 13 packs.
7) In 2008, there were 124 wolves in 12 packs. Multiple packs dissolved or dispersed.
8) In 2010, there were 96 wolves in 14 packs. The decline in numbers was thought to be from food shortages and mange (disease).
9) At the end of 2012, there were at least 83 wolves in 10 packs. The further decline in numbers was thought to from the smaller elk herd.
10) The wolf population in the park remained steady in 2013.
11) By the end of 2018 the wolf population dropped to 80 wolves in 9 packs living primarily in the park.
12) In 2019, the overall population was 94 wolves in 8 packs. The rise in population was thought to be due to high adult survival and several packs producing multiple litters.
Read more about the Yellowstone Wolves.
To see the full data descriptions of the wolf population changes over time, go off site to: https://www.yellowstone.org/wolf-project/
When you research information you must cite the reference. Citing for websites is different from citing from books, magazines and periodicals. The style of citing shown here is from the MLA Style Citations (Modern Language Association).
When citing a WEBSITE the general format is as follows.
Author Last Name, First Name(s). "Title: Subtitle of Part of Web Page, if appropriate." Title: Subtitle: Section of Page if appropriate. Sponsoring/Publishing Agency, If Given. Additional significant descriptive information. Date of Electronic Publication or other Date, such as Last Updated. Day Month Year of access < URL >.
Amsel, Sheri. "Yellowstone Wolf Project  - Population Study and Graphing Task (6-8 Grade NGSS)" Exploring Nature Educational Resource ©2005-2024. December 13, 2024
< http://exploringnature.org/db/view/Yellowstone-Wolf-Project-Population-Study-and-Graphing-Task-6-8-Grade-NGSS >